Debugging Tips of Pix (GPU Frame Capture Tools).
Not long ago, the PIX documentation was quite muddled and almost absent, for which I logged some basic usages. Definitely it is an essential tool to debug DX12 with powerful and complete functions. And till now, it maintains frequent upgrades. So for the latest functions or more detailed usages, please refer to release notes on devblog. Or maybe one day, we could trust in its documentation.
Basic Usage
- ENABLE Pix debug when compiling.
- Make sure the program use the same PLATFORM as Pix. Run Pix as admin.
- To launch an extra program by pix, in “Launch Win32” tick “Launch For GPU Capture” and input parameters in “Command line arguments”. Click Launch.
- For an immediate draw, add a pause in the code and click “GPU Capture” before rendering. Then run the program continually.
Understanding the Information Captured by Pix
https://docs.microsoft.com/en-us/visualstudio/debugger/graphics/graphics-frame-analysis?view=vs-2017
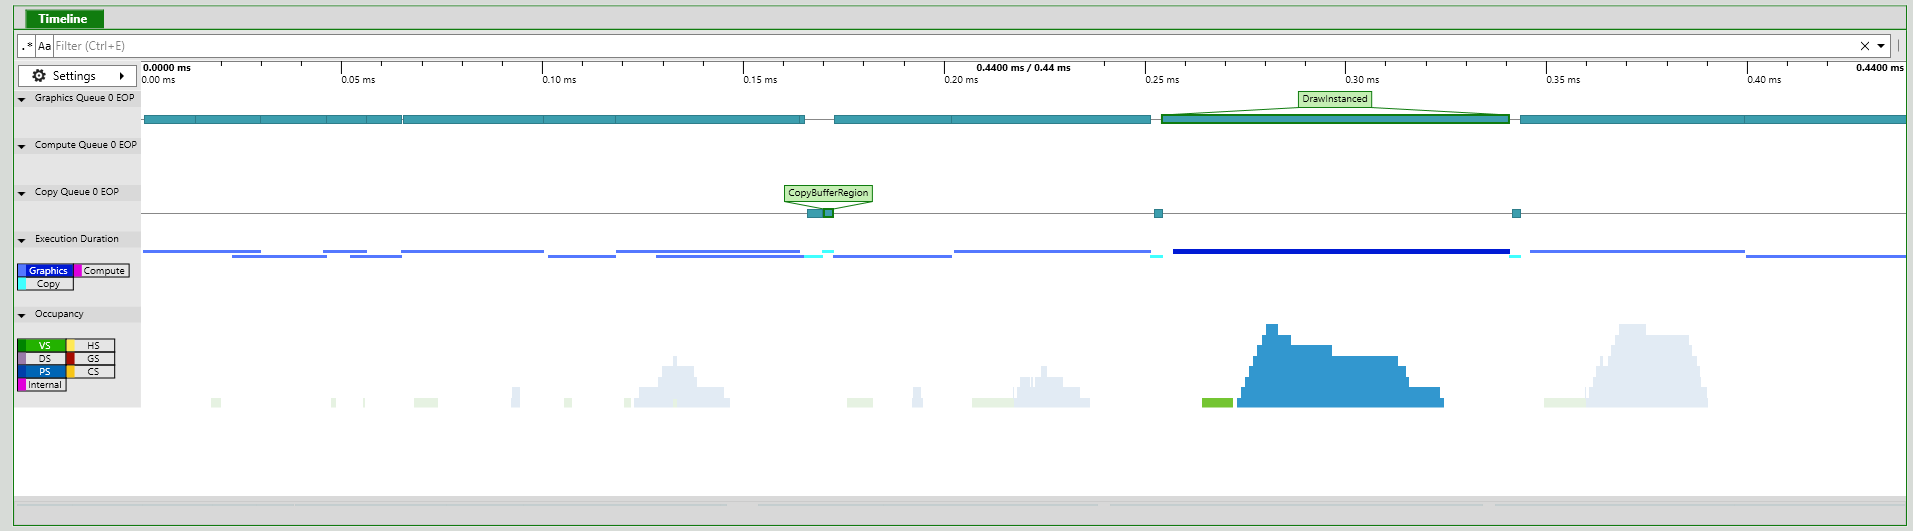
Timeline
The timeline shows an overview of draw-call timings relative to one another.
Event List
When you select an event in the event list, it’s reflected in the information; by using the event list in concert with other tools you can examine a rendering problem in detail to determine its cause.
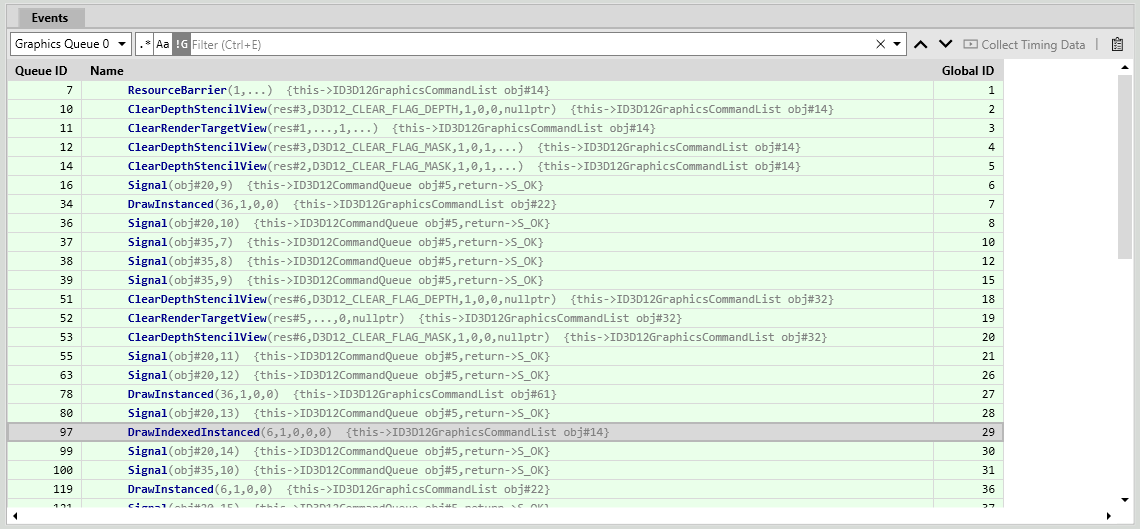
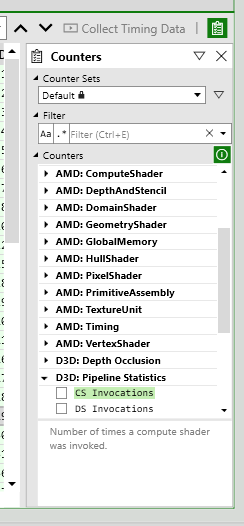
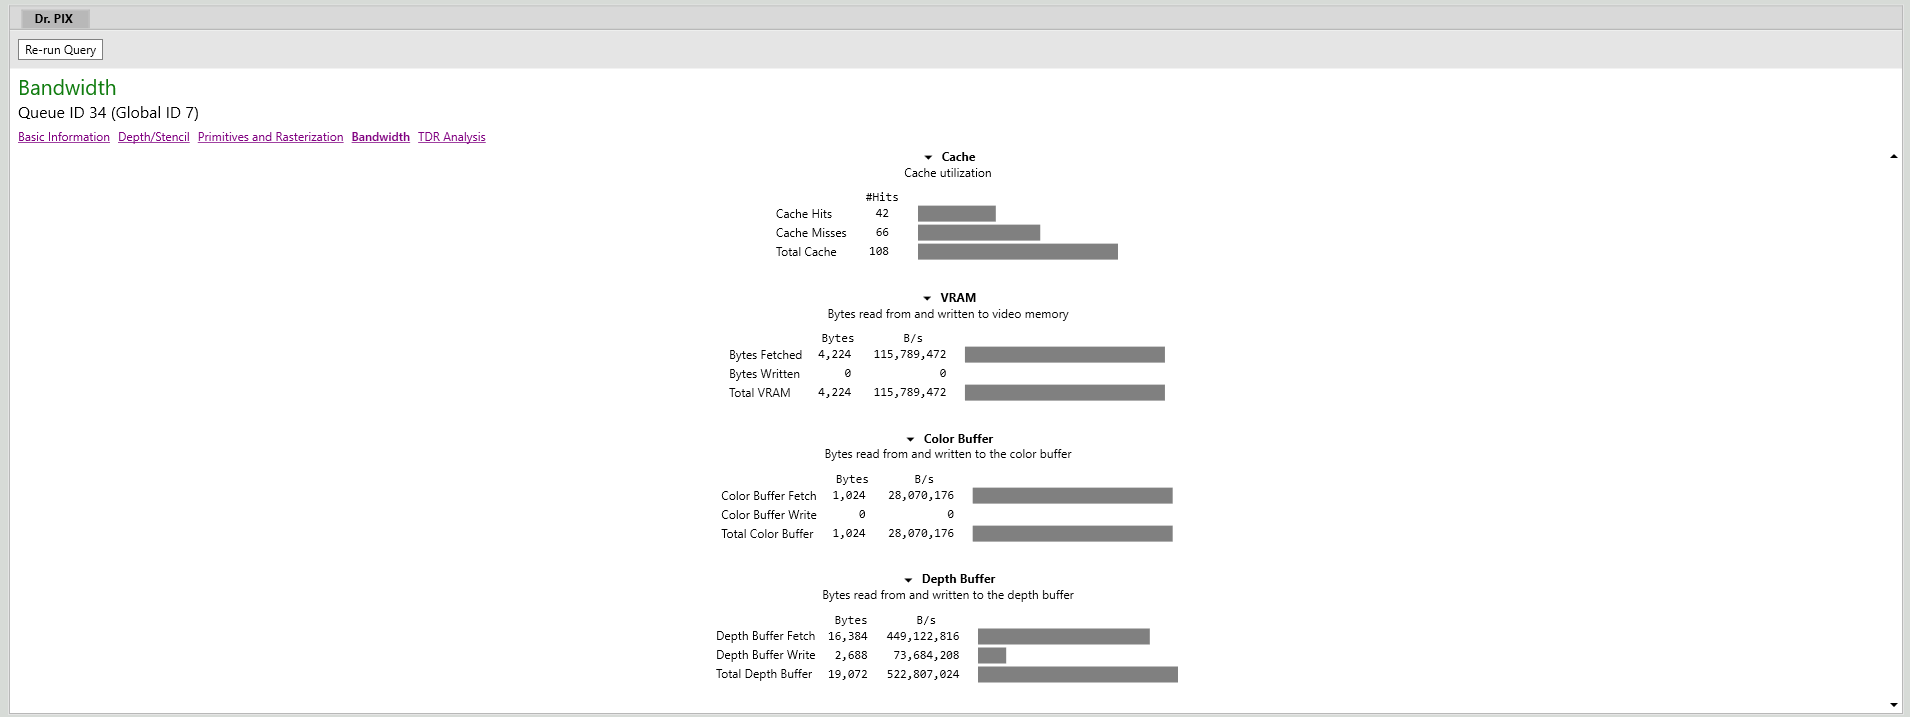
Tick parameters in “Counters” for more information.
Pipeline Stages
Input Assembler
The Input Assembler reads index and vertex data specified by your app and assembles it for the graphics hardware.
In the Pipeline Stages window, the Input Assembler output is visualized as a wireframe model. To take a closer look at the result, select IA in the Pipeline window to view the assembled vertices in full 3D using the Model Editor.
Note: If the POSITION semantic is not present in the input assembler output, then nothing is displayed in the Input Assembler stage.
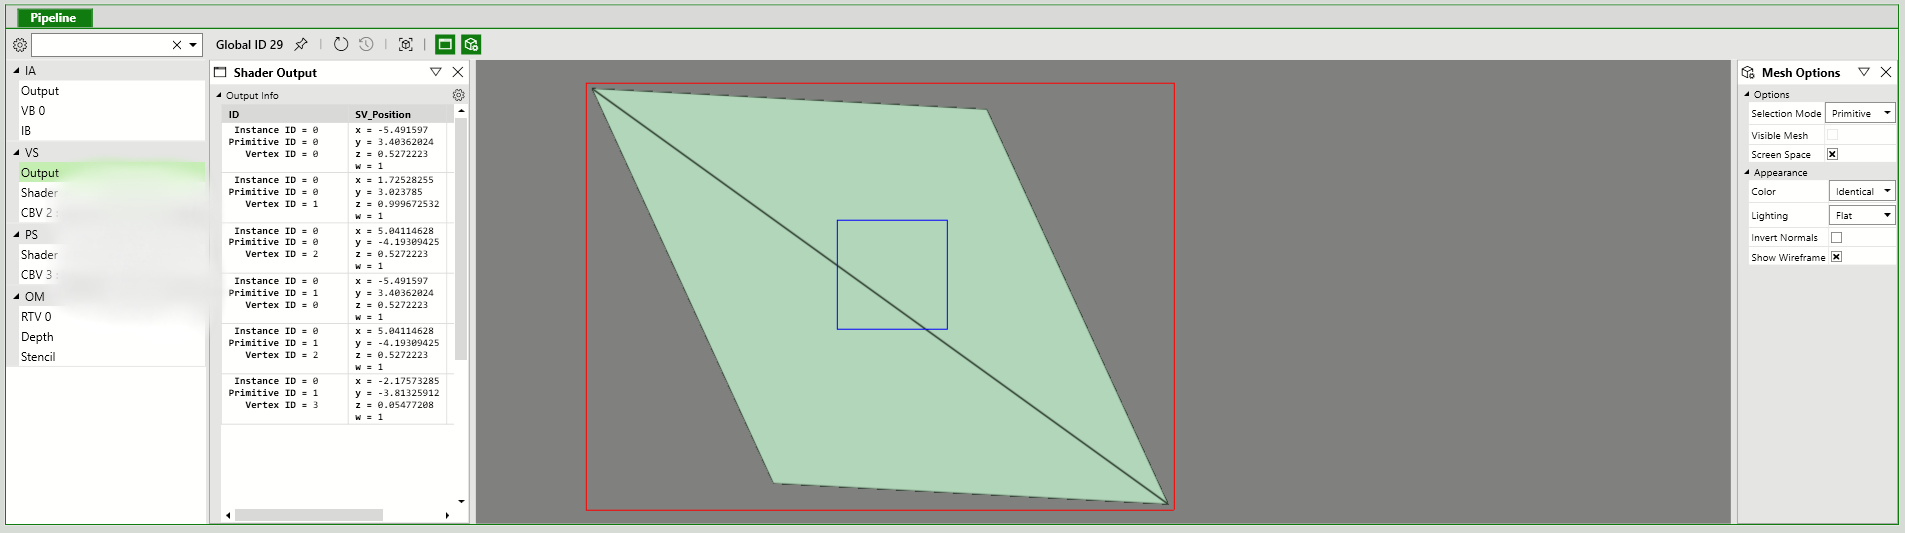
Vertex Shader
The vertex shader stage processes vertices, typically performing operations such as transformation, skinning, and lighting. Vertex shaders produce the same number of vertices that they takes as input.
In the Pipeline Stages window, the Vertex Shader output is visualized as a wireframe raster image. To take a closer look at the result, select Vertex Shader in the Graphics Pipeline Stages windows to view the processed vertices in the Image Editor.
Note: If the POSITION or SV_POSITION semantics are not present in the vertex shader output, then nothing is displayed in the Vertex Shader stage.
Hull Shader (Direct3D 11 and Direct3D 12 only)
The hull shader stage processes control points that define a low-order surface such as a line, triangle, or quad. As output it produces a higher-order geometry patch and patch constants that are passed to the fixed-function tessellation stage.
The hull shader stage is not visualized in the Pipeline Stages window.
Tessellator Stage (Direct3D 11 and Direct3D 12 only)
The tessellator stage is a fixed function (non-programmable) hardware unit that preprocesses the domain represented by the output of the hull shader. As output, it creates a sampling pattern of the domain and a set of smaller primitives—points, lines, triangles—that connect these samples.
The tessellator stage is not visualized in the Pipeline Stages window.
Domain Shader (Direct3D 11 and Direct3D 12 only)
The domain shader stage processes higher-order geometry patches from the Hull shader, together tessellation factors from the tessellation stage. The tessellation factors can be include tessellator input factors as well as output factors. As output, it calculates the vertex position of a point on the output patch according the tessellator factors.
The domain shader stage is not visualized in the Pipeline Stages window.
Geometry Shader
The geometry shader stage processes entire primitives—points, lines, or triangles—along with optional vertex data for edge-adjacent primitives. Unlike vertex shaders, geometry shaders can produce more or fewer primitives than they take as input.
In the Pipeline Stages window, geometry shader output is visualized as a wireframe raster image. To take a closer look at the result, select Geometry Shader in the Graphics Pipeline Stages window to view the processed primitives in the Image Editor.
Stream Output Stage
The stream output stage can intercept transformed primitives prior to rasterization and write them to memory; from there the data can be recirculated as input to earlier stages of the graphics pipeline or be read back by the CPU.
The stream output stage is not visualized in the Pipeline Stages window.
Rasterizer Stage
The rasterizer stage is a fixed function (non-programmable) hardware unit that converts vector primitives—points, lines, triangles—into a raster image by performing scan-line conversion. During rasterization vertices are transformed into the homogenous clip-space and clipped. As output, pixel shaders are mapped and per-vertex attributes are interpolated across the primitive and made ready for the pixel shader.
The rasterizer stage is not visualized in the Pipeline Stages window.
Pixel Shader
The pixel shader stage processes rasterized primitives together with interpolated vertex data to generate per-pixel values such as color and depth.
In the Pipeline Stages window, pixel shader output is visualized as a full-color raster image. To take a closer look at the result, select Pixel Shader in the Graphics Pipeline Stages window to view the processed primitives in the Image Editor.
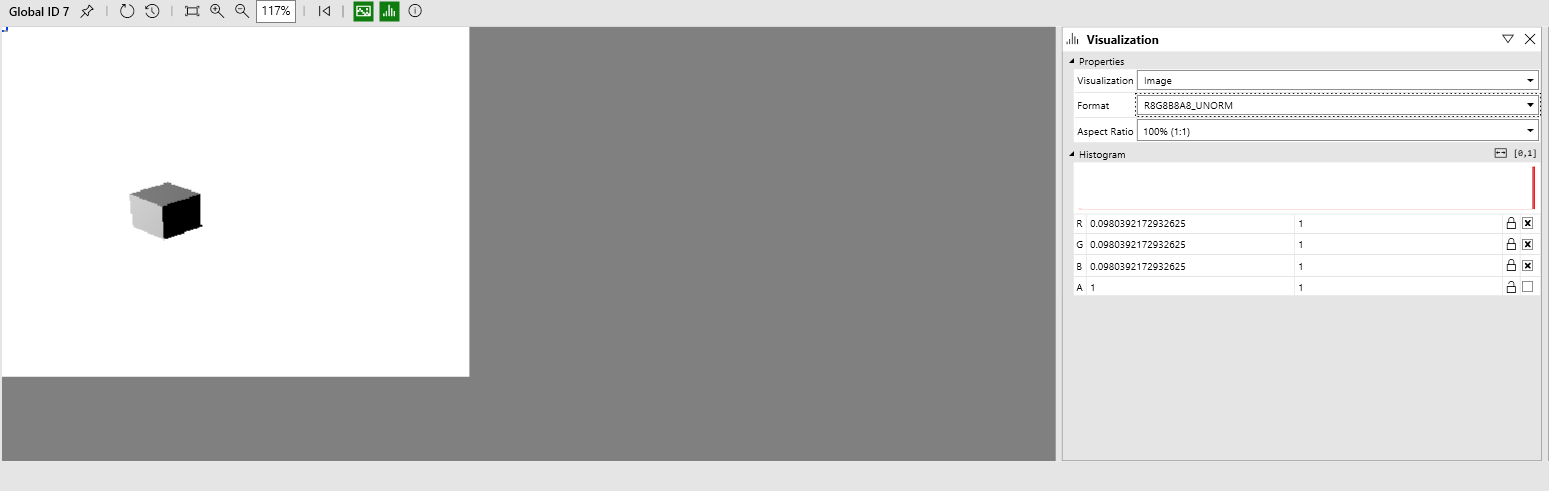
Output Merger
The output merger stage combines the effect of newly-rendered pixels together with the existing contents of their corresponding buffers—color, depth, and stencil—to produce new values in these buffers.
In the Pipeline Stages window, output merger output is visualized as a full-color raster image. To take a closer look at the results, select Output Merger in the Graphics Pipeline Stages window to view the merged framebuffer.
As the following image shows, with Pix we can collect more information than with VS Graphics Tools. Moreover, Pix can be used by wide range of applications.
Call Stack
This one is similar with the call stack in VS, while it records detailed GPU methods one by one.
Pixel History
![]()
Graphics Object Views
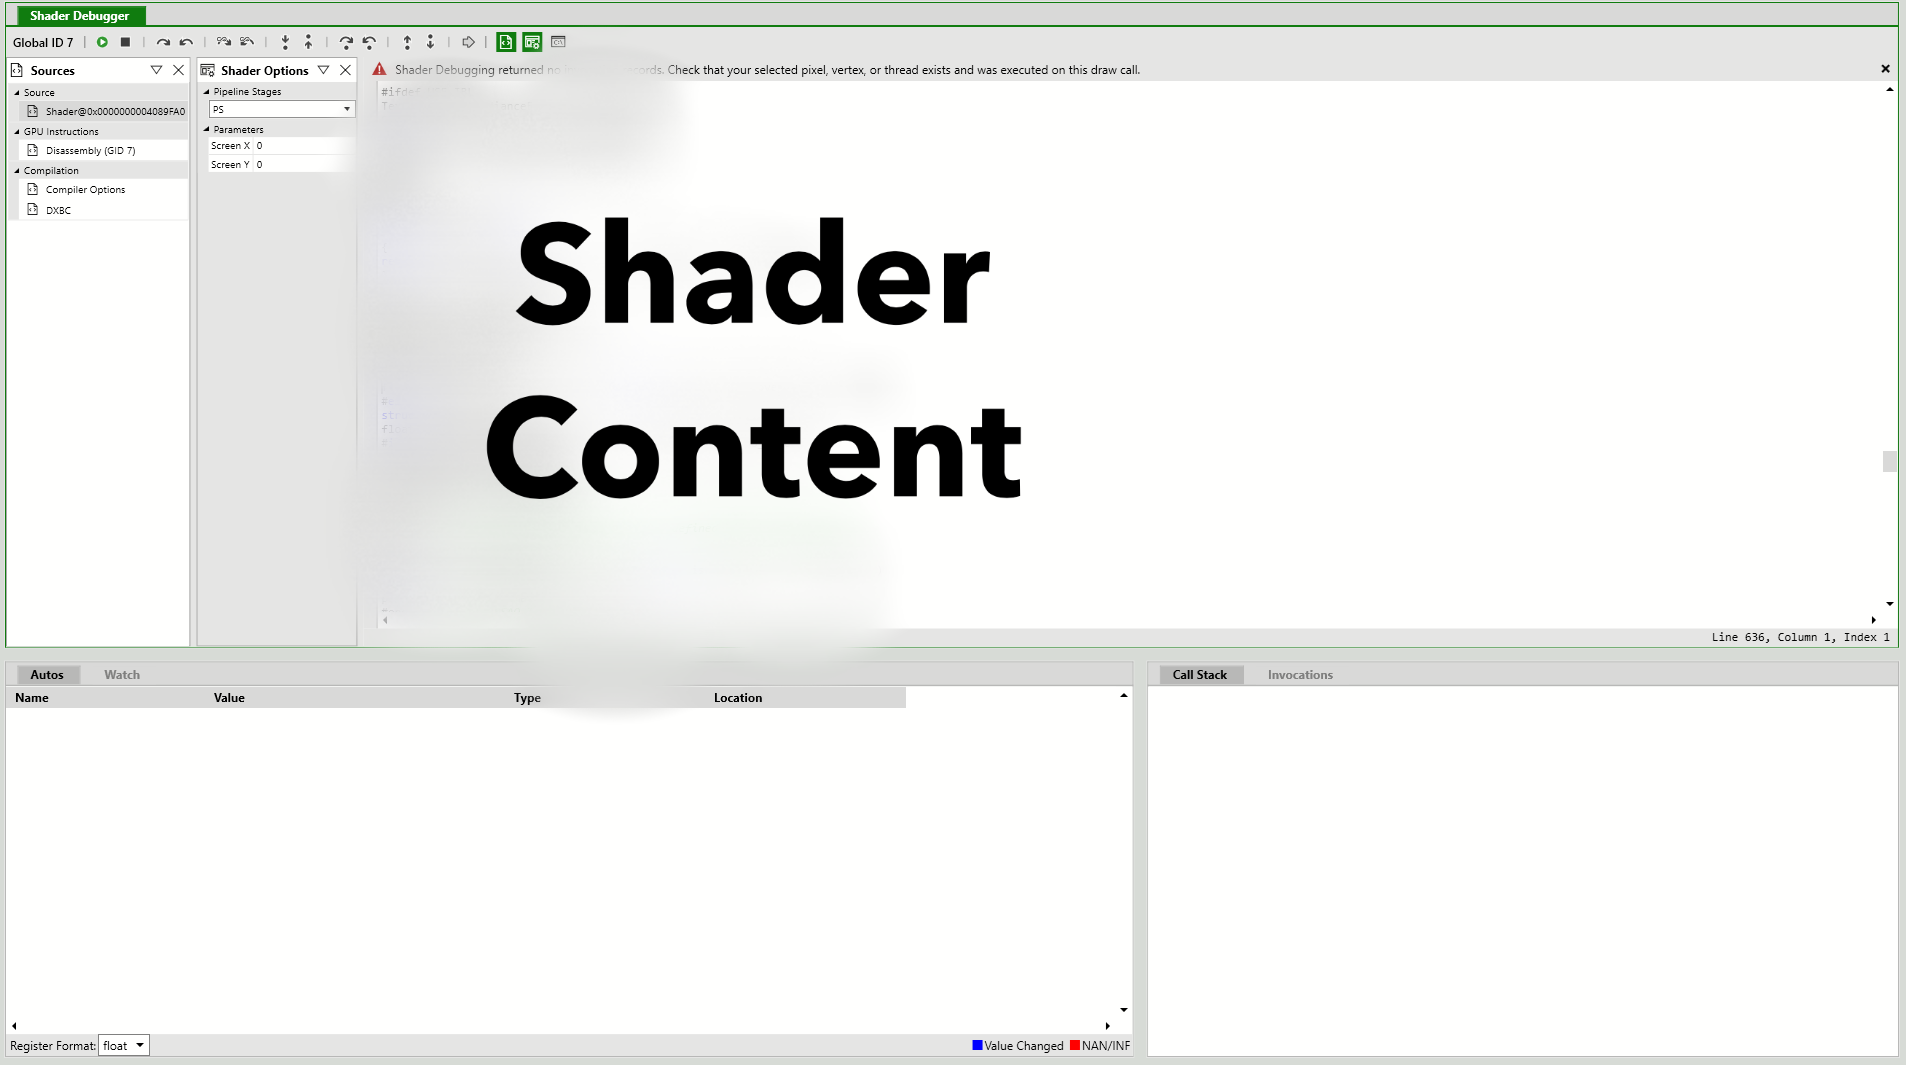
Shader Debugger
With shader debugger, we can debug compiled shader code (e.g. .hlsl) just like other source code!