Collecting VS2017 Debugging Tips from diverse resources.
Change the execution flow
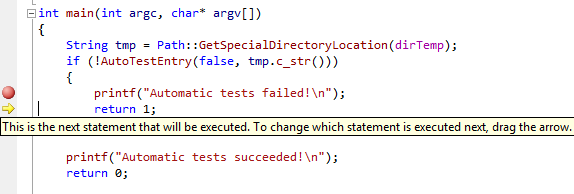
A typical debugging situation is to analyze why a function call failed by stepping through. When another function that finds a function call returns an error and does not restart, use the yellow statement to identify the statement you want to execute next, thus changing the code location where the thread will execute next.
Grab the yellow arrow (the execution pointer) on the left and move the yellow arrow to the line above the method you want to step into. Be careful Moving the pointer cannot revert your application to an earlier app state.
Watch Windows
Pseudo-variables in Watch Window
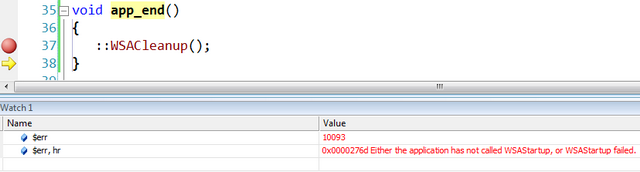
The Watch windows or the QuickWatch dialog support some special (debugger-recognized) variables called pseudo variables. The documented ones refer to MS Docs
If you want to display only the Dynamic View for an object, you can use the dynamic format specifier:
- C#: ObjectName, dynamic
- Visual Basic:: $dynamic, ObjectName
The Dynamic View also enhances the debugging experience for COM objects. When the debugger encounters a COM object wrapped in System.__ComObject, it adds a Dynamic View node for the object.
Format Specifiers
If you have the following code:
1 | int main() { |
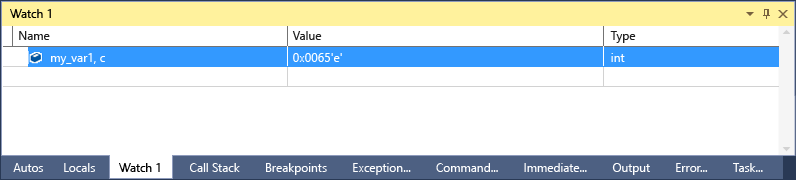
Add the my_var1 variable to the Watch window (while debugging, Debug > Windows > Watch > Watch 1), and then set the display to hexadecimal (in the Watch window, right-click the variable and select Hexadecimal Display). Now the Watch window shows that it contains the value 0x0065. To see this value expressed as a character instead of an integer, in the Name column, after the variable name, add the character format specifier, c.
The Value column now appears with 101 ‘e’.
Here lists all the specifiers.
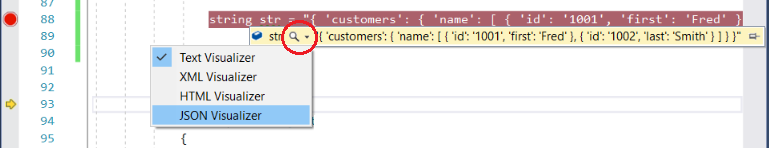
String Visualizer
View Return Values for Functions
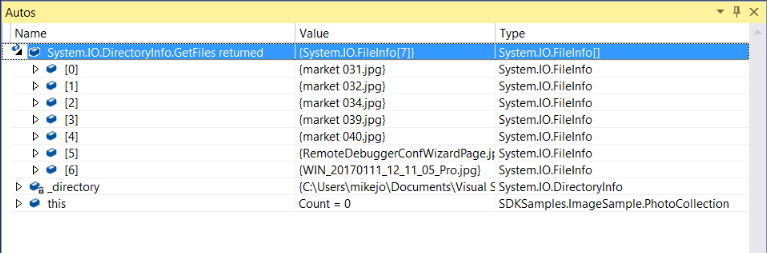
To view return values for your functions, look at the functions that appear in the Autos window while you are stepping through your code. To see the return value for a function, make sure that the function you are interested in has already executed (press F10 once if you are currently stopped on the function call). If the window is closed, use Debug > Windows > Autos to open the Autos window.
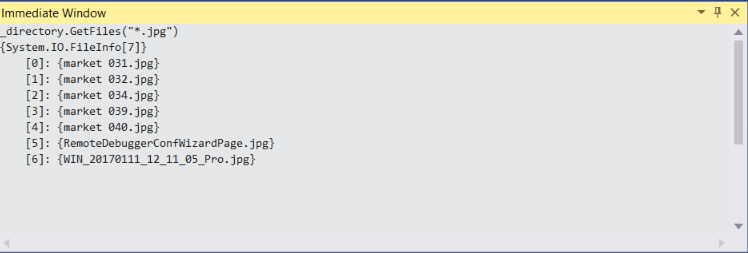
In addition, you can enter functions in the Immediate window to view return values. (Open it using Debug > Windows > Immediate.)
Use the context operator in C++ to qualify a breakpoint location, variable name, or expression.
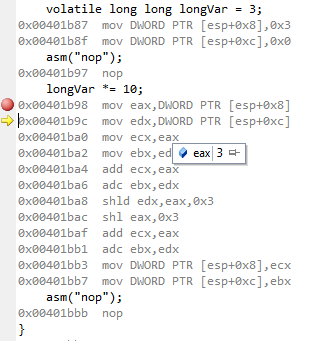
Disassembly Code
Disassembly Code is created by Just-in-Time (JIT) compiler, not the Microsoft intermediate language (MSIL) generated by the Visual Studio compiler.
optional information:
- Memory address where each instruction is located. For native applications, this is the actual memory address. For Visual Basic, C#, or managed code, it is an offset from the beginning of the function.
- Source code from which the assembly code derives.
- Code bytes—byte representations of the actual machine or MSIL instructions.
- Symbol names for the memory addresses.
- Line numbers corresponding to the source code.
Breakpoints
conditions (T/F; changed); hit count; filter (Expression & Logical Operators; Particular Thread); actions; tags (for sort); labels; export/import; etc.
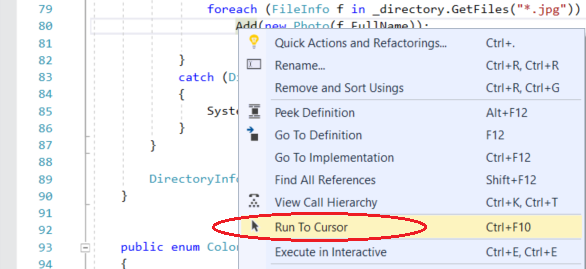
Run to Cursor
Right-click a line of code in your app and choose Run to Cursor. This command starts debugging and sets a temporary breakpoint on the current line of code.
If you have set breakpoints, the debugger pauses on the first breakpoint that it hits.
Press F5 until you reach the line of code where you selected Run to Cursor.
You can use Run to Cursor in the Call Stack window while you are debugging.
Run to a Function Specified by Name
You can tell the debugger to run your application until it reaches a specified function. You can specify the function by name or you can choose it from the call stack.
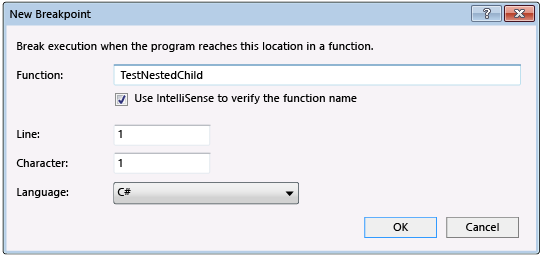
To specify a function by name, choose Debug, New Breakpoint, Break at Function, then enter the name of the function and other identifying information.
To narrow the function specification:
- Use the fully qualified function name. Example:
Namespace1.ClassX.MethodA() - Add the parameter types of an overloaded function. Example:
MethodA(int, string) - Use the ‘!’ symbol to specify the module. Example:
App1.dll!MethodA - Use the context operator in native C++.
{function, , [module]} [+<line offset from start of method>]Example:{MethodA, , App1.dll}+2 - Use the address of an object to set a breakpoint on a method called on a specific instance of a class. Native C++ Only. Example:
((my_class *) 0xcccccccc)->my_method
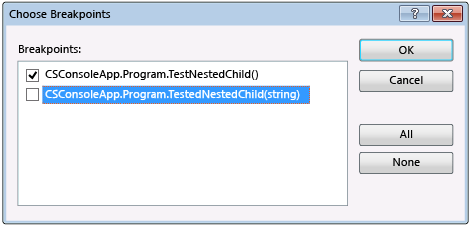
If the function is overloaded or is in multiple namespace, you can choose the functions that you want in the Choose Breakpoints dialog box.
Other Situation
You can also set breakpoints in the call stack, in the Disassembly window, and, in native C++ code, at a data condition or a memory address. Click here for more information.
To set breakpoint conditions:
https://docs.microsoft.com/en-us/visualstudio/debugger/using-breakpoints?view=vs-2017#breakpoint-conditions.
Log a message to Output window with special keywords:
https://docs.microsoft.com/en-us/visualstudio/debugger/using-breakpoints?view=vs-2017#BKMK_Print_to_the_Output_window_with_tracepoints
Memory
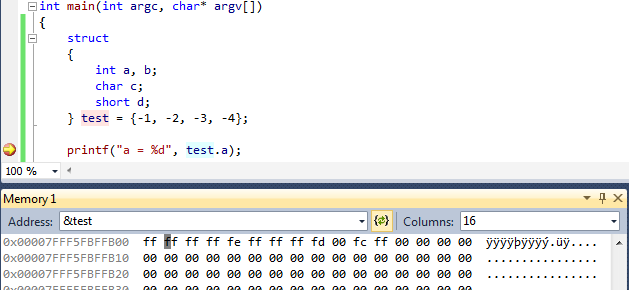
Some bugs are caused by incorrect struct definitions, ignored alignment properties, etc.
Multithread
- For threads, the primary tools for debugging threads are the Threads window, thread markers in source windows, Parallel Stacks window, Parallel Watch window, and the Debug Location toolbar. To learn about the Threads window and Debug Location toolbar, see Walkthrough: Debug using the Threads Window. To learn how to use the Parallel Stacks and Parallel Watch windows, see Get started debugging a multithreaded application. Both topics show how to use thread markers.
- For code that uses the Task Parallel Library (TPL) or the Concurrency Runtime, the primary tools for debugging are the Parallel Stacks window, the Parallel Watch window, and the Tasks window (the Tasks window also supports JavaScript). To get started, see Walkthrough: Debugging a Parallel Application and Walkthrough: Debugging a C++ AMP Application.
- For debugging threads on the GPU, the primary tool is the GPU Threads window. See How to: Use the GPU Threads window.
- For processes, the primary tools are the Attach to Process dialog box, the Processes window, and the Debug Location toolbar.
Thread Markder
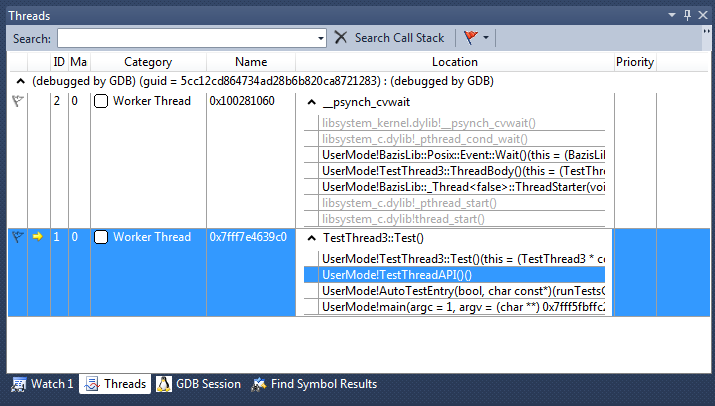
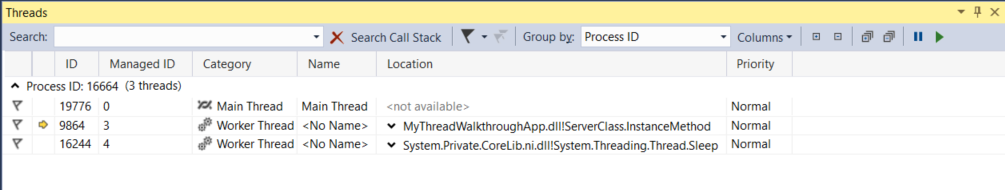
Threads Window (Debug) with Callstack:
To discover the thread marker:
In the Debug Toolbar, click the Show Threads in Source button
 .
.Press F11 once to advance the debugger one line of code.
Look at the gutter on the left side of the window. On this line, you will see a thread marker icon
 that resembles two cloth threads. The thread marker indicates that a thread is stopped at this location. Notice that a thread marker may be partially concealed by a breakpoint.
Hover the pointer over the thread marker. A DataTip appears. The DataTip tells you the name and thread ID number for each stopped thread. In this case, the name is probably
<noname>.Right-click the thread marker to see the available options on the shortcut menu.
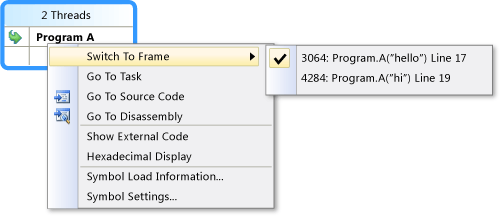
View the Location of Threads
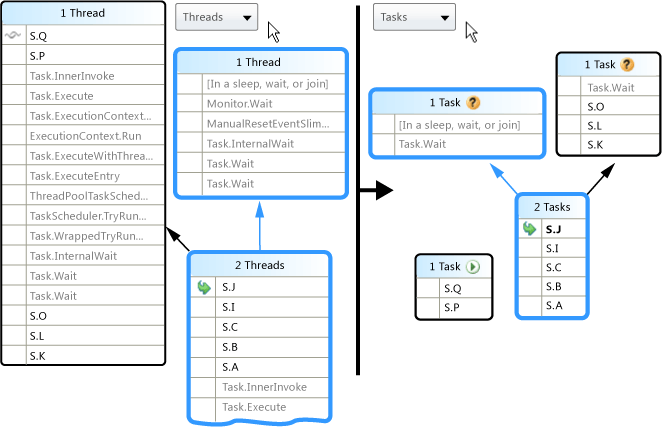
In the Parallel Stacks window, you can switch between a Threads view and (for task-based programming) Tasks view, and you can view call stack information for each thread.
Open the Parallel Stacks window by choosing Debug > Windows > Parallel Stacks. You should see something similar to this (the exact information will be different depending on the current location of each thread, your hardware, and your programming language).
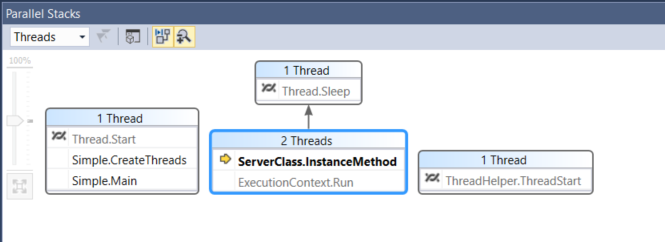
Threads View shows call stack information for all the threads in your application. It lets you navigate between threads and stack frames on those threads. In managed code, the Tasks View shows call stacks of System.Threading.Tasks.Task objects. In native code, the Tasks View shows call stacks of task groups, parallel algorithms, asynchronous agents, and lightweight tasks.
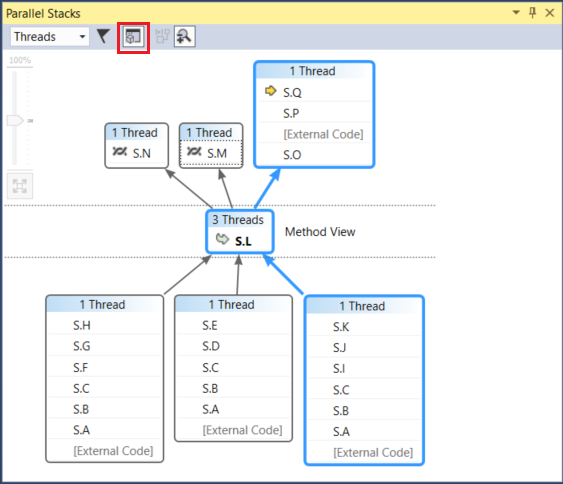
Method View
Flagging and Unflagging Threads
You can flag threads that you want to give special attention. Flagging threads is a good way to keep track of important threads and to ignore threads that you do not care about.
To flag threads:
- In the Parallel Watch window, hold down the SHIFT key and select multiple rows.
- Right-click and choose Flag. Now, all the selected threads are flagged. Now, you can filter to show only flagged threads.
- In the Parallel Watch window, find the Show Only Flagged Threads button

- Click the Show Only Flagged Threads button.
Depending on the thread ID, thread name, process ID, process name, machine name, etc., it is determined whether the thread is broken. Logical operations can be performed between the conditions; Right-click another thread and then we can Switch to Thread. Thread name can be set in both native code and managed code.
Freezing and Thawing Thread Execution
You can freeze and thaw (suspend and resume) threads to control the order in which threads perform work. This can help you resolve concurrency issues such as deadlocks and race conditions.
To freeze and unfreeze threads:
- In the Parallel Watch window, with all the rows selected, right-click and select Freeze. In the second column, a pause icon now appears for each row. The pause icon indicates that the thread is frozen.
- Show the Suspended Count column by selecting it in the Columns list.
- Deselect the rows by clicking one row only.
- Right-click a row and select Thaw. The pause icon goes away on this row, indicating that the thread is no longer frozen.
- Switch to the code editor and click F11. Only the unfrozen thread runs. The app may also instantiate some new threads. Notice that any new threads are unflagged and are not frozen.
Switch Between Processes
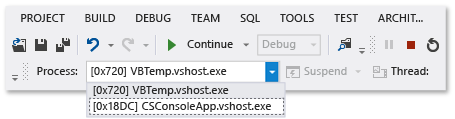
You can attach to multiple processes when you are debugging, but only one process is active in the debugger at any given time. You can set the active or current process in the Debug Location toolbar or in the Processes window. To switch between processes, both processes must be in break mode.
To set the current process:
On the Debug Location toolbar, choose Process to view the Process list box. Select the process that you want to designate as current process.
If the Debug Location toolbar is not visible, choose Tools, Customize. On the Toolbars tab, choose Debug Location.
Open the Processes window (shortcut Ctrl+Alt+Z), find the process that you want to set as the current process, and double-click it.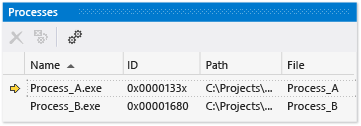
Set a Breakpoint on a Specific Process
- Get the process name or process ID number from the Processes window.
- Select a breakpoint, and open the Breakpoint Filter dialog box as in the first procedure.
- In the Breakpoint Filter dialog box, type:
ProcessName = yourprocessnameorProcessID = yourprocessIDnumber. To create a more complex filter, you can combine clauses using &, the AND operator, ||, the OR operator, !, the NOT operator, and parentheses. - Click OK.
Set a Breakpoint on a Specific Thread
- Get the thread name or thread ID number from the Threads window.
- Select a breakpoint, and open the Breakpoint Filter dialog box as described in the first procedure.
- In the Breakpoint Filter dialog box, type:
ThreadName = yourthreadnameorThreadID = yourthreadIDnumber. To create a more complex filter, you can combine clauses using &, the AND operator, ||, the OR operator, !, the NOT operator, and parentheses. - Click OK.
More Reading:
Walkthrough: Debugging a Parallel Application in Visual Studio
Step into Specific
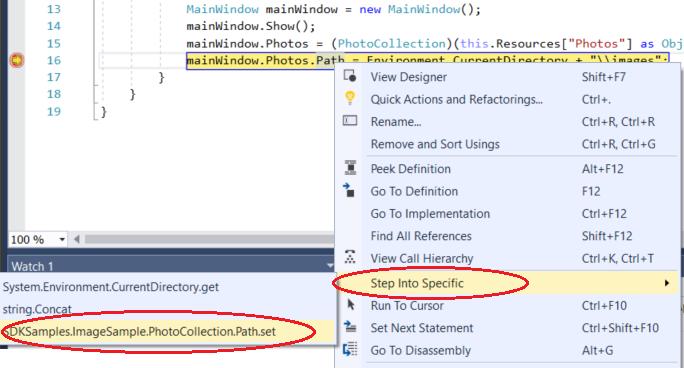
It can be widely used!
Snapshot Debugger
To debug live ASP.NET apps in Azure App Service: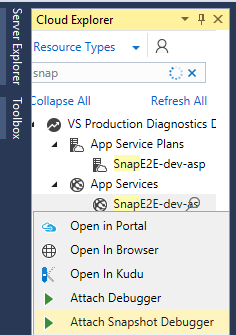
For more information, see Debug live ASP.NET apps using the Snapshot Debugger.
View snapshots with IntelliTrace Step-back:
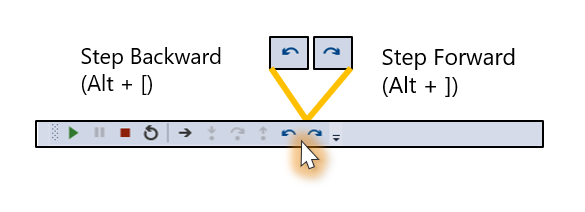
For more information, see the View snapshots using IntelliTrace step-back and IntelliTrace page.
Exception
Break into Code on Handled Exceptions
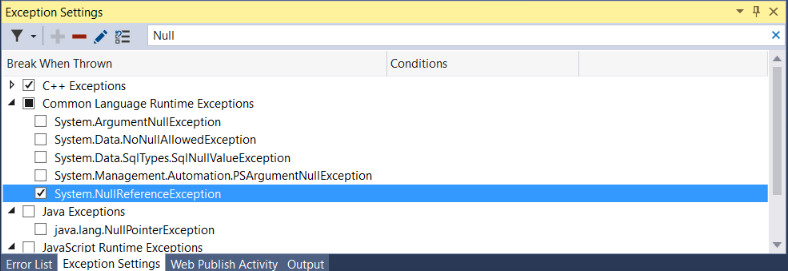
The debugger breaks into your code on unhandled exceptions. However, handled exceptions (such as exceptions that occur within a try/catch block) can also be a source of bugs and you may want to investigate when they occur. You can configure the debugger to break into code for handled exceptions as well by configuring options in the Exception Settingsdialog box. Open this dialog box by choosing Debug > Windows > Exception Settings.
The Exception Settings dialog box allows you to tell the debugger to break into code on specific exceptions. In the illustration below, the debugger breaks into your code whenever a System.NullReferenceException occurs. For more information, see Managing exceptions.
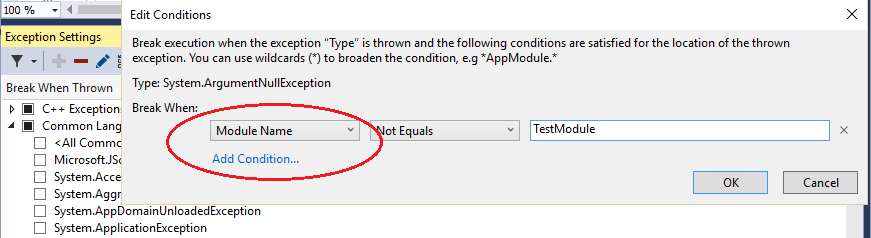
Add Conditions to an Exception
You can set conditions on exceptions in the Exception Settings dialog box. Currently supported conditions include the module name(s) to include or exclude for the exception. By setting module names as conditions, you can choose to break for the exception only on particular code modules, or you can avoid breaking on particular modules.
Note
Adding conditions to an exception is new in Visual Studio 2017
To add conditional exceptions, choose the Edit condition icon in the Exception Settings dialog box or right-click the exception and choose Edit Conditions.
GPU Debugging
Configuring GPU Debugging
The debugger cannot break on both CPU code and GPU code in the same app execution. By default, the debugger breaks on CPU code. To debug GPU code, use one of these two steps:
- In the Debug Type list on the Standard toolbar, choose GPU Only.
- In Solution Explorer, on the shortcut menu for the project, choose Properties. In the Property Pages dialog box, select Debugging, and then select GPU Only in the Debugger Type list.
NOTE: Independent hardware vendors who want to support GPU debugging in Visual Studio must create a DLL that implements the VSD3DDebug interface and targets their own drivers.
Other Tips
- Symbol Files (Program Database .pdb); Generate Symbol Files
- Just My Code
- Call Stack Map
- Set Step Into Properties & Operators
- Setting a Data Breakpoint (native C++ only)
- Register Values
- Edit and Continue Debugging
- Find DLL Crashed in And Examine System Code After an Exception
- View Script Documents
- Native Run-time Checks
- Debugger Tips and Tricks (including: Attach to processes; Debug with Just- In-Time)
- Set breakpoint by code
- C/C++ Assertions
Reference
- http://www.cnblogs.com/lazycoding/archive/2012/10/03/2710738.html
- https://msdn.microsoft.com/zh-cn/library/5557y8b4.aspx
- https://www.codeproject.com/Articles/469416/10-More-Visual-Studio-Debugging-Tips-for-Native-De
- https://www.codeproject.com/Articles/518159/10-Even-More-Visual-Studio-Debugging-Tips-for-Nati
- VS2017 Debugging Docs